The only purpose of this post is to be public and belong to all relevant categories — this enables WordPress to auto-generate lists of categories (it ignores ones that contain only private posts).
Posts
my results on calibration
I did this….
more
Message to Nick
What I want:
When a lab member (with the password, which is BSL2019) enters the password-protected part of the blog, I want them to land on a page that has tag and category menus that allow us to navigate our posts. But these links shouldn’t be viewable on the static pages that constitute the outward-facing web presence.
BSL internal materials
This is where we can post information for our group — things we want to be able to look up. Particularly nice data, examples of calibration measurements, methods of alignment. Also where we can have conversations.
Easy to insert additional blocks, including pictures.
New post
How do we see our posts?
Fixed Cell Measurement Protocol
- Put coverslip with adherent cells in the sample chamber and wash with PBS. This involves gently spraying the PBS on the coverslip with a pippette, and gently rocking the sample chamber back and forth. This should only require about 0.5 mL of PBS.
- Aspirate PBS and fill chamber with 1 mL of 4% formaldehyde. Let sit for 15 minutes at room temperature (in cell prep box, covered with a chem wipe).
- There are variances in both time and temperature (some incubate rather than using room temperature), so this is something that could be varied if desired.
- Aspirate formaldehyde and wash twice with PBS. Aspirate PBS.
- For measurements, fill with HBSS at 37C as is typical with live cell measurements.
IRAM Raman 1um beads 2/25/16
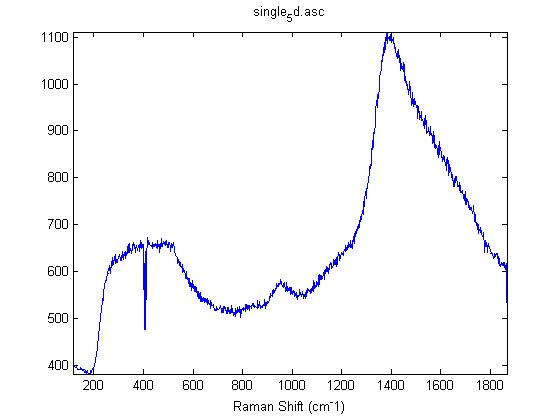

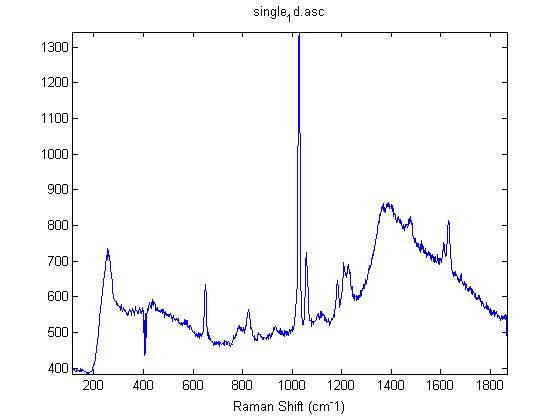
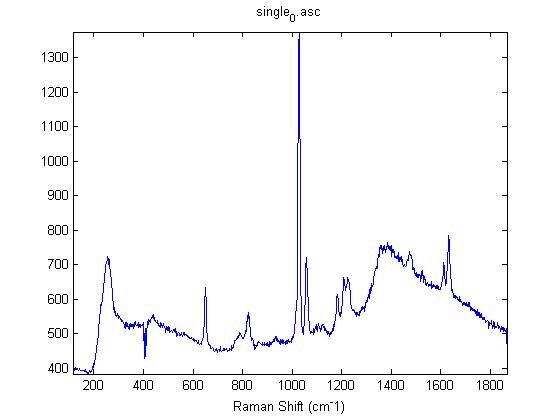
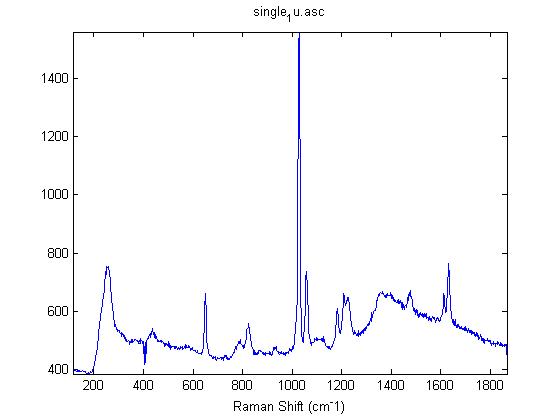
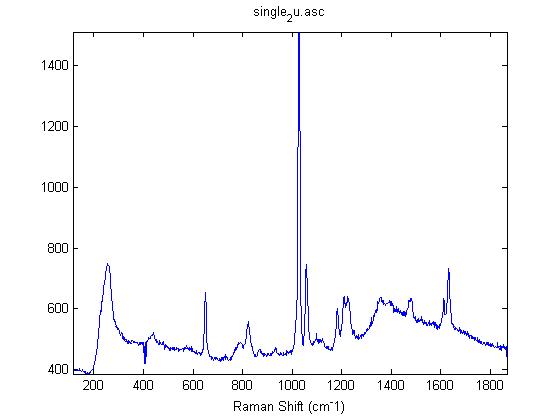
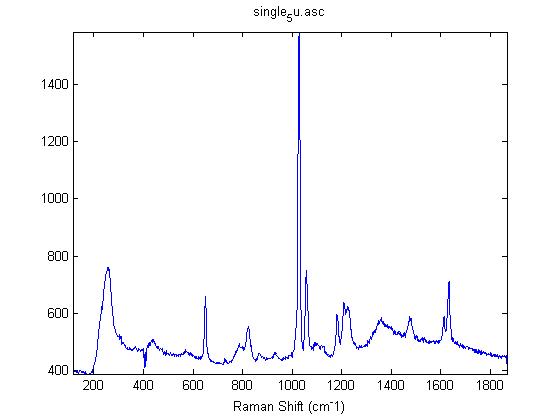

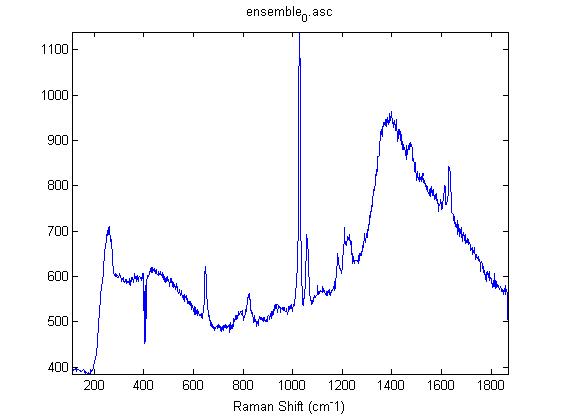
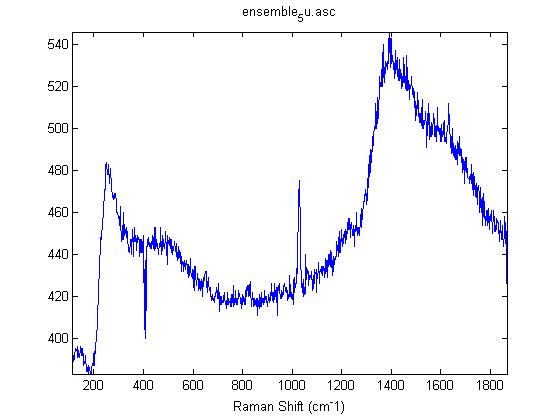
Raman Spectra of 1um beads taken at 20s exposure times. Spectra were taken at different axial positions of trapped bead(s?) and a group of beads that were adhered to the cover slip. These positions ranged from about 5 (microns?) above and below the cover slip (full range is shown for individual beads while select points are shown for the ensemble). The “glass edge” on the right is dominant in all of the adhered ensemble spectra while it disappears as the focus moved farther into the sample for the trapped bead.
Some sources of uncertainty are: 1)finding a place where a bead could be trapped and wouldn’t get knocked out by other beads coming into the trap or leave on its own (I had to start 5 microns above the coverslip to get a stable trap). 2)I used the back reflection of the glass on the microscope’s ccd as a reference point. When I was finishing measurements, I noticed the position of the back reflection was not where I originally set my “0” point (This is not the first time this has been noticed, but I wanted to make a note of it here) 3)I’m pretty sure that 1 increment on the fine tuning knob (which is what I was using to move the objective) corresponds to 1 micron, but I haven’t been able to 100% verify this. 4)Looking at published spectra, the pixel to wavenumber calibration may be slightly off (peaks are shifted to the right a bit). 5)This spectra was taken after looking for and reducing sources of power loss in the Raman path. Part of the process involved adjusting a filter that cleans up the laser light and that may explain the floor around 200 cm^-1
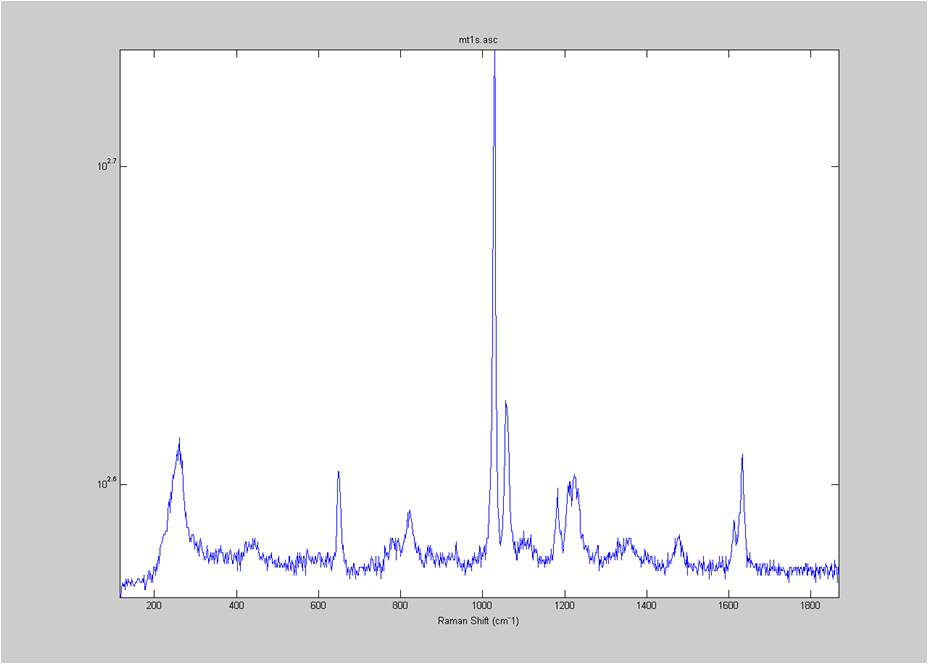
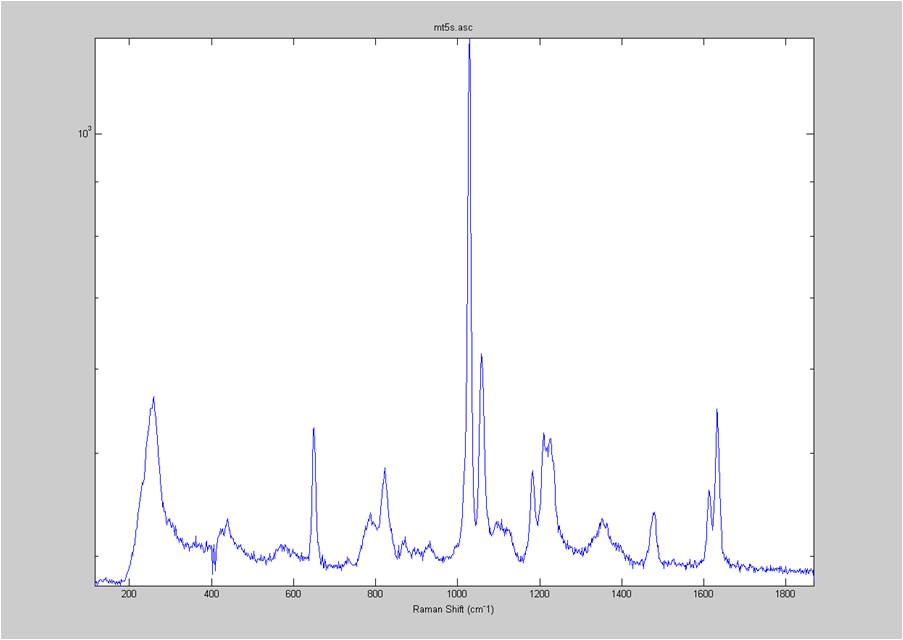
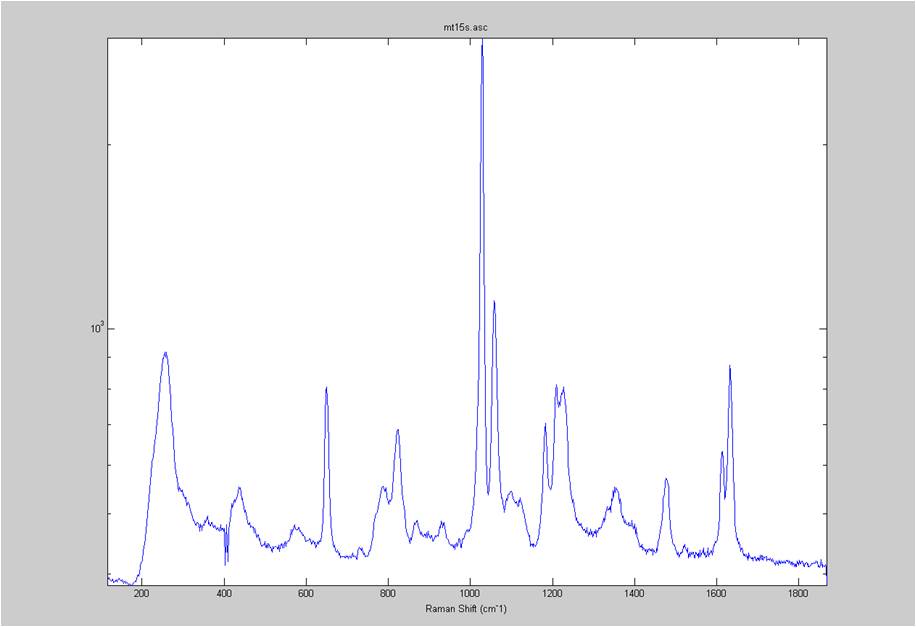
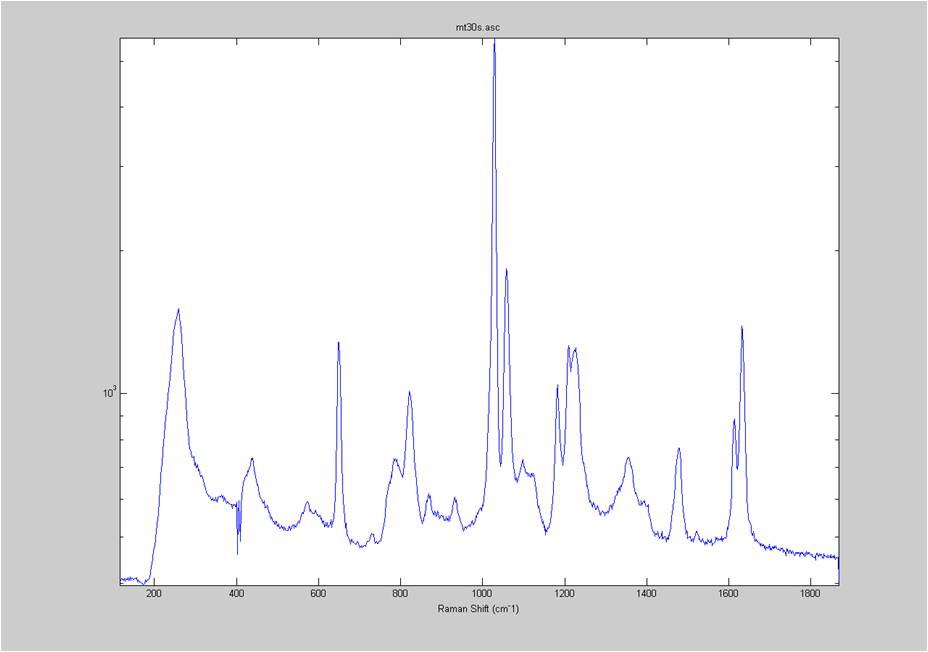
IRAM Raman-Polystyrene Block 02/23
Raman spectra of a plastic block taken at different exposure times ranging from 1 second to 2 minutes (range in images shown is 1 to 30 seconds). Increasing exposure time reduced noise but also increased background. Spectra was collected with the oil objective and the block in direct contact with the objective, so changing depth was not an option. I also looked at how the spectra looked using the full CCD (fvb) and a subset corresponding to an individual fiber from the bundle (mt).


Investigation of Mechanical Properties of Cornea via Raman
- We plan to use 10-20 pig (ideally human) corneas and take Raman Spectra. Then Professor Buckle’s lab can perform mechanical tests (modulus identification) on the same cornea samples to compare with Raman signal. We hope to see some correlation between the mechanical properties and Ramen signal, which may show up in collagen concentrations or in hydration.
- We also can take the spectra of several corneas at different levels of swelling, which may provide an alternative way to compare Raman signal to mechanical properties.
- Crosslinking of corneal collagen is of some interest as well. We will need to investigate if the Raman spectrometer is sensitive to changes in the of corneal collagen.
- In the end Professor Buckley is interested in finding a way to diagnose Keratoconus in human cornea before the onset of corneal thinning. Our goal is to develop a way of analyzing the mechanical properties of the cornea via Raman spectroscopy.
- Future: In vivo Raman imaging of cornea is also of some interest, however we are not sure if this can be/has been done before. Air pump test – correlation between pressures and mechanical properties?
Journal club paper for 2/5/16
Hi guys,
Here is the link to the Judy Mourant paper that we’ll be discussing at this week’s group meeting. Should be another good discussion, especially for us on the angular scattering project!