IRAM Raman 1um beads 2/25/16

single_5dsingle_2dsingle_1dsingle_0single_1usingle_2usingle_5uensemble_5d ensemble_0 ensemble_5u

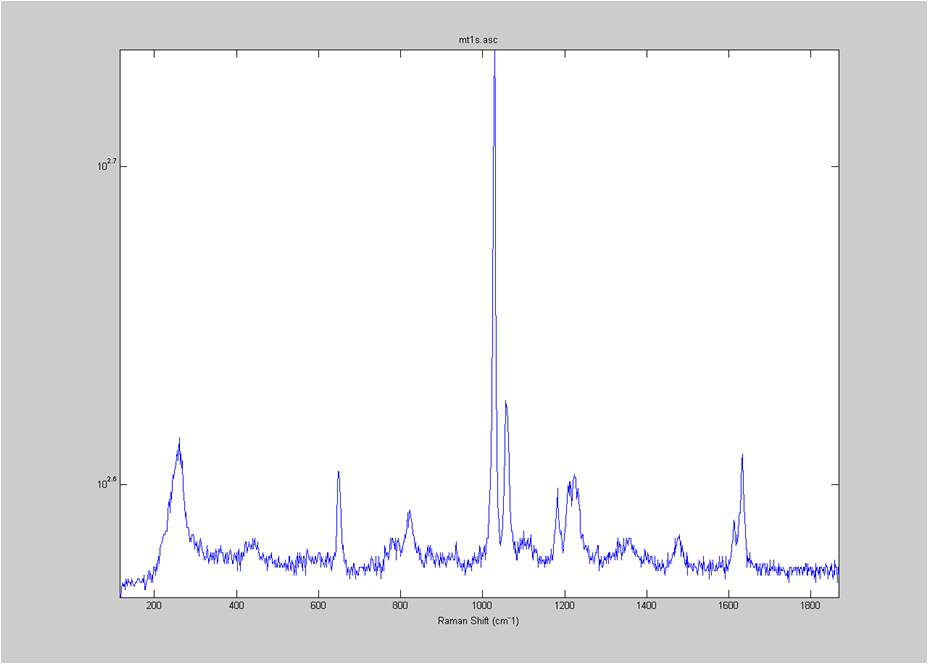
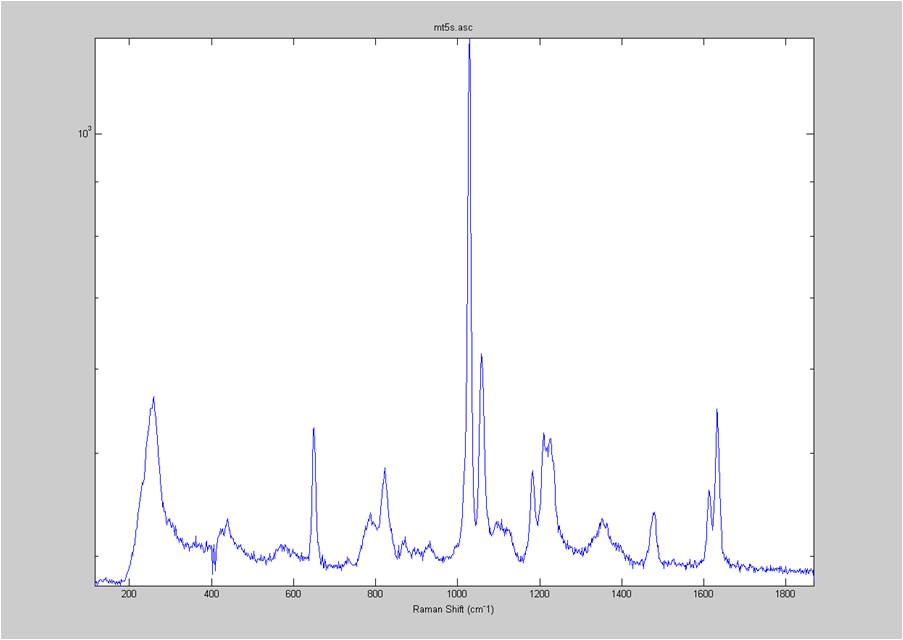
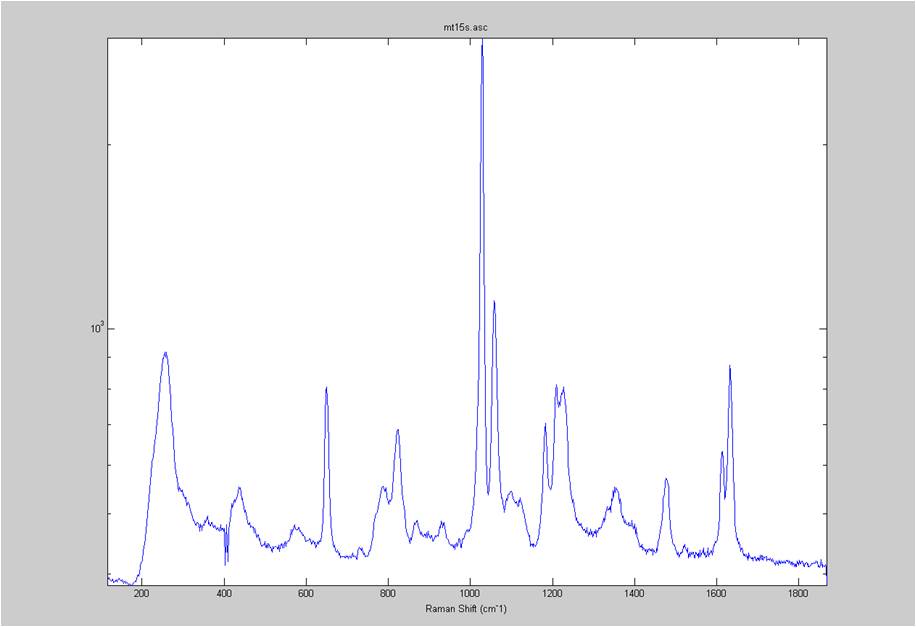
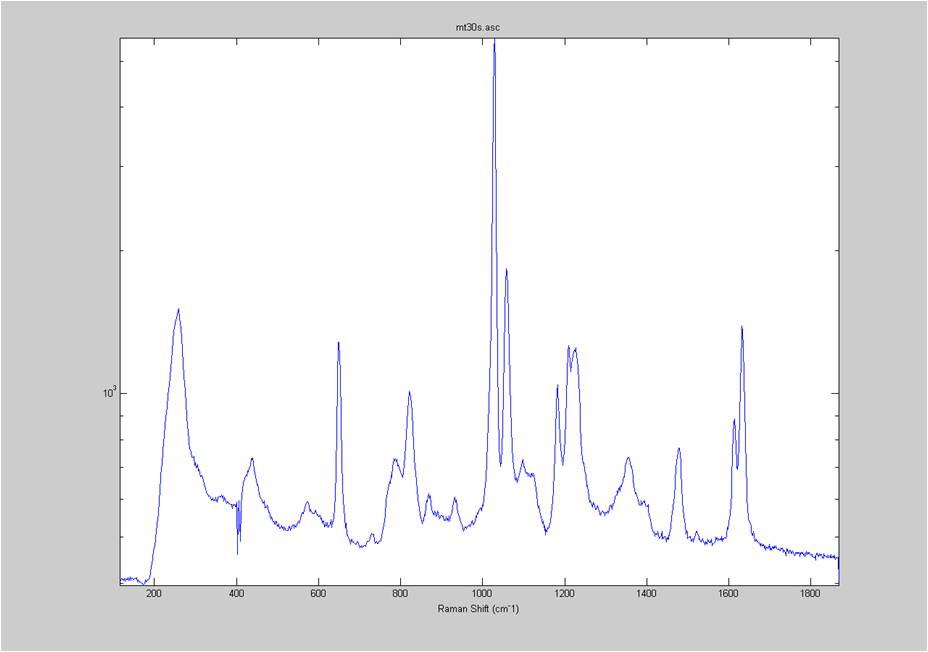
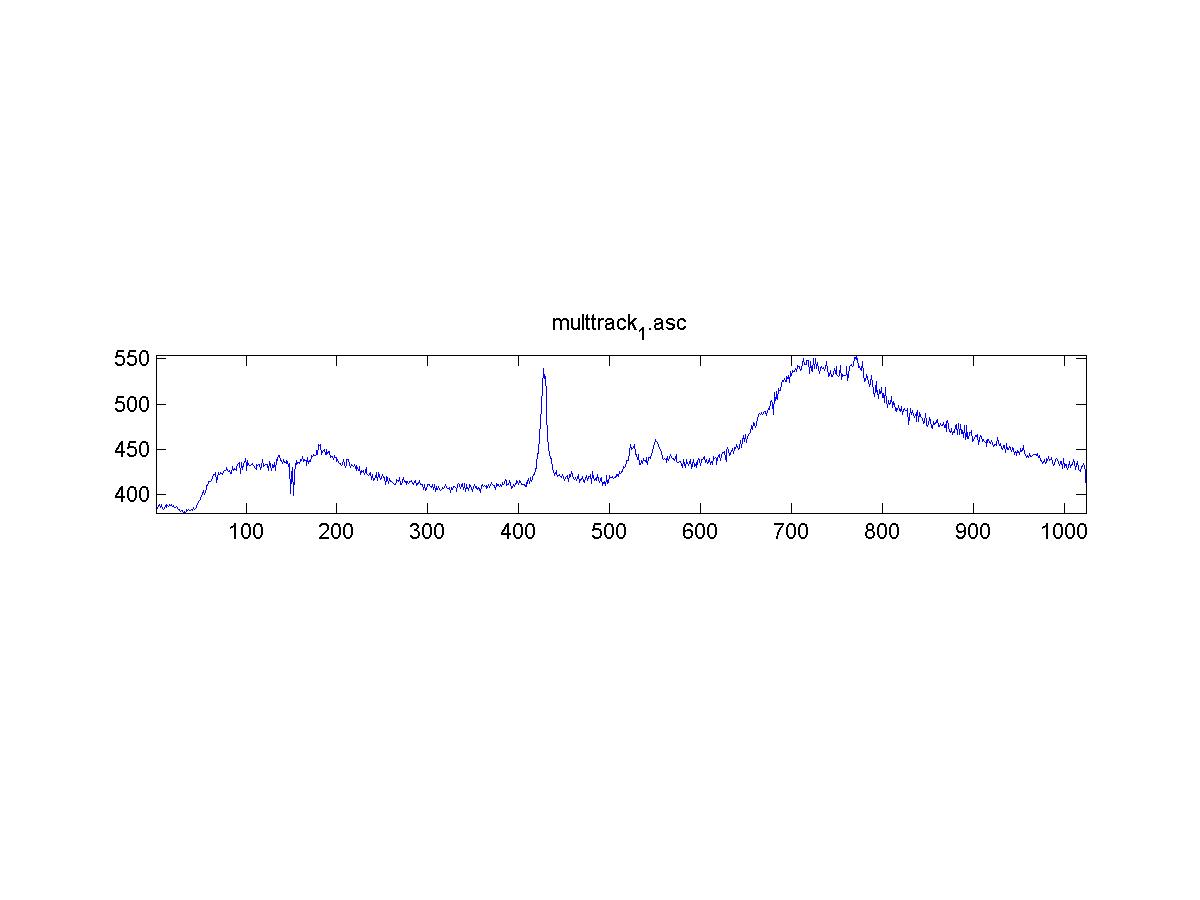
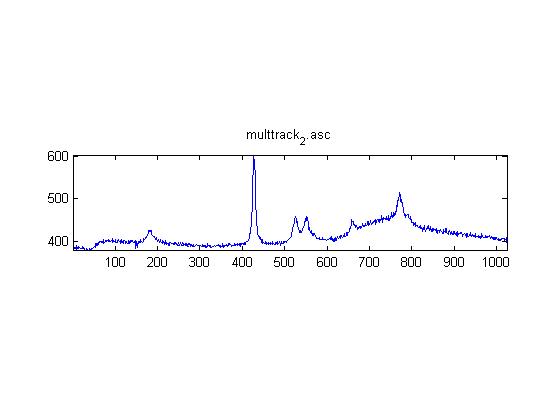
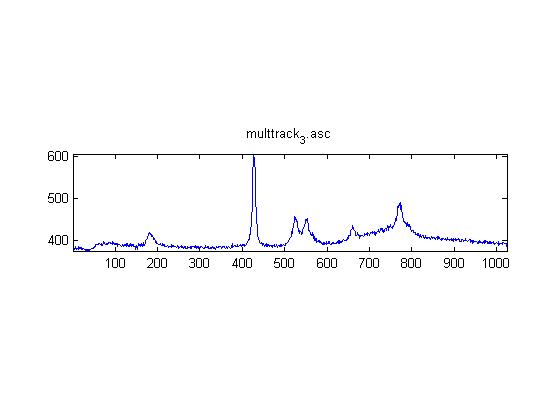
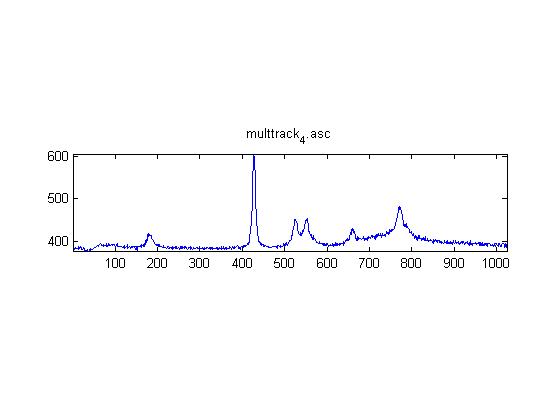
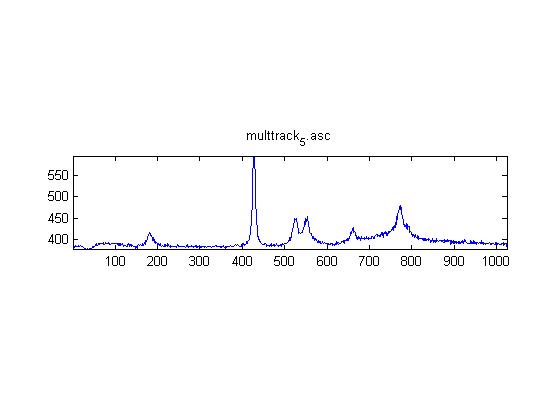
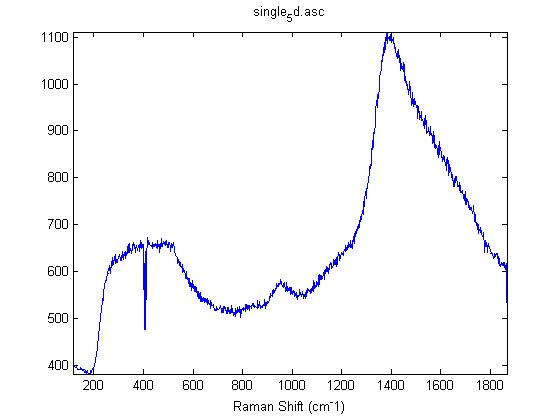
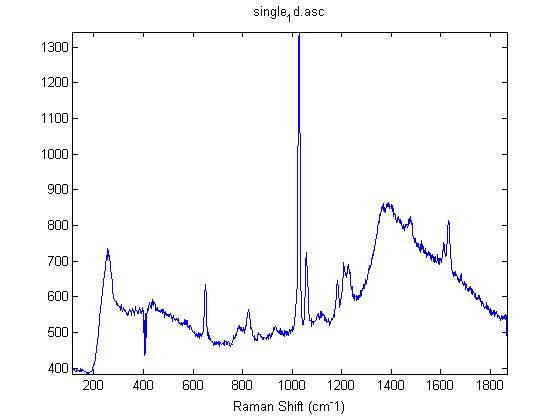
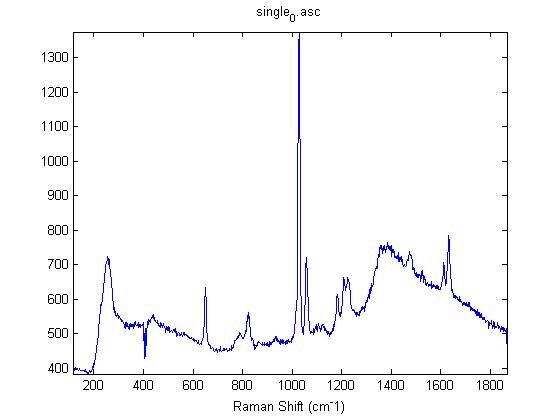
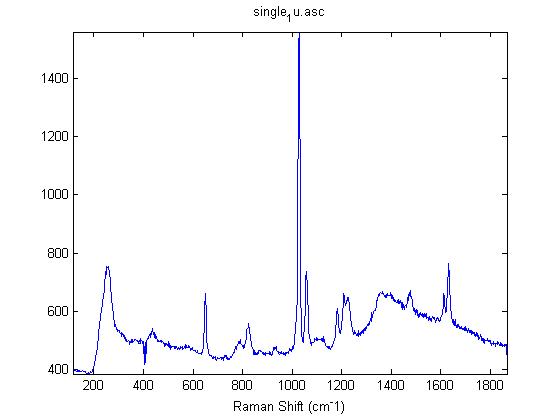
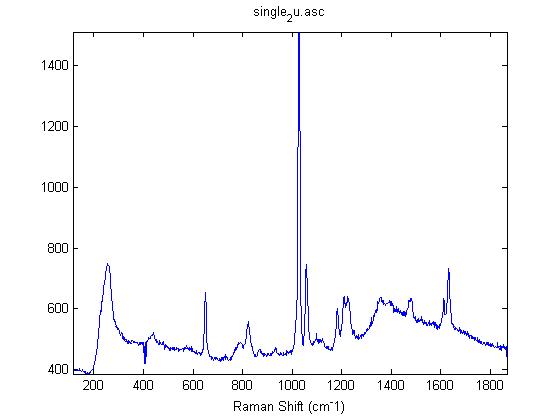
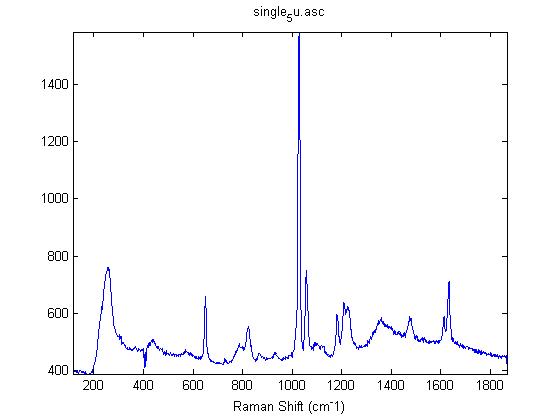
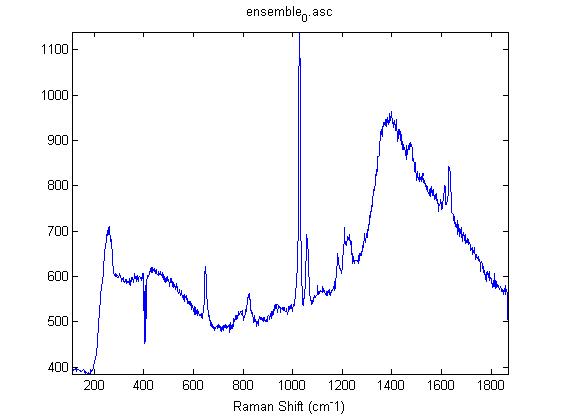
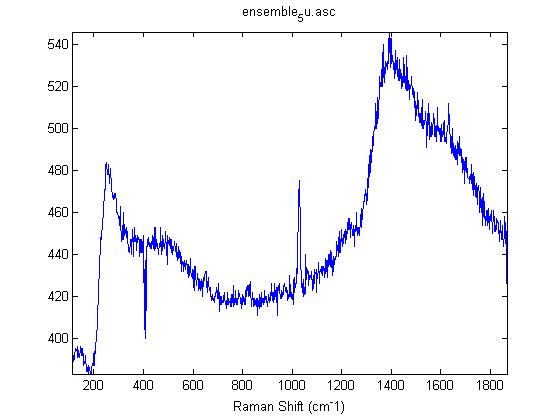
Raman Spectra of 1um beads taken at 20s exposure times.  Spectra were taken at different axial positions of trapped bead(s?) and a group of beads that were adhered to the cover slip.  These positions ranged from about 5 (microns?) above and below the cover slip (full range is shown for individual beads while select points are shown for the ensemble).  The “glass edge” on the right is dominant in all of the adhered ensemble spectra while it disappears as the focus moved farther into the sample for the trapped bead.

Some sources of uncertainty are: 1)finding a place where a bead could be trapped and wouldn’t get knocked out by other beads coming into the trap or leave on its own (I had to start 5 microns above the coverslip to get a stable trap). 2)I used the back reflection of the glass on the microscope’s ccd as a reference point. When I was finishing measurements, I noticed the position of the back reflection was not where I originally set my “0” point (This is not the first time this has been noticed, but I wanted to make a note of it here) 3)I’m pretty sure that 1 increment on the fine tuning knob (which is what I was using to move the objective) corresponds to 1 micron, but I haven’t been able to 100% verify this. 4)Looking at published spectra, the pixel to wavenumber calibration may be slightly off (peaks are shifted to the right a bit). 5)This spectra was taken after looking for and reducing sources of power loss in the Raman path. Part of the process involved adjusting a filter that cleans up the laser light and that may explain the floor around 200 cm^-1


IRAM Raman-Polystyrene Block 02/23

Raman spectra of a plastic block taken at different exposure times ranging from 1 second to 2 minutes (range in images shown is 1 to 30 seconds). Increasing exposure time reduced noise but also increased background.  Spectra was collected with the oil objective and the block in direct contact with the objective, so changing depth was not an option.  I also looked at how the spectra looked using the full CCD (fvb) and a subset corresponding to an individual fiber from the bundle (mt).

fvb1s fvb5s mt1s mt5s mt15s mt30

Investigation of Mechanical Properties of Cornea via Raman

  1. We plan to use 10-20 pig (ideally human) corneas and take Raman Spectra. Then Professor Buckle’s lab can perform mechanical tests (modulus identification) on the same cornea samples to compare with Raman signal. We hope to see some correlation between the mechanical properties and Ramen signal, which may show up in collagen concentrations or in hydration.
  2. We also can take the spectra of several corneas at different levels of swelling, which may provide an alternative way to compare Raman signal to mechanical properties.
  3. Crosslinking of corneal collagen is of some interest as well. We will need to investigate if the Raman spectrometer is sensitive to changes in the of corneal collagen.
  4. In the end Professor Buckley is interested in finding a way to diagnose Keratoconus in human cornea before the onset of corneal thinning. Our goal is to develop a way of analyzing the mechanical properties of the cornea via Raman spectroscopy.
  5. Future: In vivo Raman imaging of cornea is also of some interest, however we are not sure if this can be/has been done before. Air pump test – correlation between pressures and mechanical properties?

IRAM Raman-Ethanol

Ethanol @ Interface multtrack_2plotmulttrack_3plot multtrack_4plot multtrack_5plot

These are Raman spectra of ethanol taken using the IRAM system. Images were taken at multiples of 5 microns into the sample, starting from the coverslip/ethanol interface to 25 microns into the sample.   As the focus goes deeper in to the sample, the effects of the coverslip (ex broad peak at the high end) become less prominent.

Exposure time was 10 seconds.  Spectra was taken from a section of the image that was 10 pixels tall, corresponding to light going into a single fiber of the fiber bundle.

Raman Spectra of Cornea (Raw and Smoothed Data)


1CorneaSample_60x_100s_Singletrack_Corrected1CorneaSample_60x_100s_Singletrack_Smooth

Notable Peaks

Amide III (protein): 1225-1275 cm-1

Amide I (protein): 1640-1675 cm-1

Phenylalanine (amino acid): 1003 cm-1

Tryptophan (amino acid): 760 cm-1 and 881 cm-1

Tyrosine (amino acid): 646 cm-1

CH2-CH3 bending band: 1275-1500 cm-1

Most peaks are accurately represented in our data, however some peaks seem to be shifted. Such as our Phenylalanine peak at 1010 cm-1 when it should be at 1003 cm-1. We believe this is an issue with the calibration from pixel to wavelength.

Questions regarding future evaluation of Ramen data of Cornea

1. How does the quality of our data set compared to what we expect to see out of Ramen signal from Cornea?

a. Set up two different data sets: one with raw data, and another      one with smooth data (in matrix).
b. Set up a mean spectrum and calculate the trend of different peaks relative to the mean spectrum.

2. What biological information can we extract from the data set?

a. Hydration? Collagens? Mechanical Property? Chemical Property? Ratio of multiple peak strengths?

3. How do certain peaks change as we image different spatial positions or depth positions of sample?

a. Using the depth scanning / spatial actuator to quantify the peak strength.

4. Find publications regarding the area of interest in mechanical property of cornea.

Wavelength and Raman shift calibration

Before data acquisition, the Wavelength and and Raman shift of the scattered light needs to be calibrated.  A gas-discharged neon lamp needs to be used for wavelength calibration.

Wavelength Calibration:

Step 1: Taking spectrum data using neon lamp and then making plot of neon spectrum: Intensity vs. pixel.

Step 2: Using theoretical neon spectrum plot ( Intensity vs. wavelength) to identify neon peaks on the plot in Step 1 and making plot: wavelength vs. pixel.

Step 3: Making a third-order polynomial regression of the known wavelengths of neon on the corresponding pixel numbers.

Now, pixel numbers are able to be converted to wavelength by using the third-order polynomial relation.

Raman shift calibration:

Step 1: Taking spectrum data from any sample with known Raman shift spectrum(like Tylenol)

Step 2: Converting pixel to wavelength for Tylenol data and then plotting Tylenol spectrum: wavelength vs. pixel

Step 3: Using theoretical spectrum of Tylenol to identify peaks on the plot of Step 2 and save these peak points

Step 4: Using the equation: 1/laser wavelength = Raman shift +1/ wavelength of tylenol vibration to estimate the laser wavelength for each Tylenol vibration. Then take the average of laser wavelength.

Step 5: By using the equation in step 4 and the average laser wavelength, the wavelength is able to be converted into Raman shift