
Energy generation by Energy Services and Sustainability (ESS) to serve River Campus and Medical Center buildings make up a large majority (approximately 85%) of the University of Rochester’s total carbon emissions. In the summer of 2022, ESS launched a fault detection and diagnostics (FDD) pilot program to test the building analytics software’s capability in terms of detecting and diagnosing faulty HVAC equipment and operations. Now with a proactive approach to HVAC maintenance and space comfort, the University sees an increase in energy efficiency, reduced costs, and lower carbon emissions.
What is FDD?
FDD is powered by cloud-based building analytics software that can make longer term pattern recognition to discover areas that are using more energy than necessary. The software is constantly running, finding inefficiencies, and pointing them out to operators in a dashboard. From there, they can either fix the problem remotely when possible or dispatch workers to the location. These flagged areas can be ranked in terms of cost, energy, comfort, and maintenance. Timothy Vann, energy engineer at ESS, noted that using FDD is helping operators be more proactive, allowing them to solve problems and inefficiencies early on.
ESS tested two different softwares, Clockworks Analytics and CopperTree Analytics, split evenly between six buildings. LeChase Hall and Wegmans Hall on the River Campus, along with Helen Wood Hall at the Medical Center, were connected to Clockworks Analytics software, while the University Health Services and Genesee Hall on the River Campus, along with Saunders Research Building at the Medical Center, were linked to CopperTree Analytics software. After concluding the pilot, ESS did a comparison analysis between the two softwares and found that Clockworks Analytics resulted in a better performance. The buildings linked to CopperTree are now in process for conversion to Clockworks software.
Results
ESS calculated the total savings across the 600,00 square feet that were monitored by Clockworks. These savings include:
- 220 MWh electricity per year
- 190,000 ton-hours of chilled water per year
- 4,200 mmBTU of hot water per year
- 769 tons of carbon dioxide per year
This reduction in electricity, hot water, and chilled water usage saved ESS and the University over $130,000 per year.
Project highlight: Saunders Research Building
The FDD team had particular success at the Saunders Research Building during the pilot, where their work on just one project saved 100 MWh of electricity and 2,908 mmBTUs, translating to an annual saving of $62,000 in just one building.
The FDD software detected a potential issue in multiple HVAC zones in the building. Upon further investigation, the FDD team discovered that the occupancy sensors in these zones were always registering as “on” even if no one was in the area, meaning that they were being unnecessarily over ventilated, over cooled, and then subsequently over reheated. After even more investigation and analysis, they discovered the root cause of the problem was the old lighting system that provided occupancy sensor data and were able to work with the vendor to update the equipment so it would function properly.
Where does FDD go now?
Step one of expanding FDD at the University is to swap over the buildings that were on the other FDD software to Clockworks. ESS is pursuing funding to add buildings with their leading candidate being the Kornberg Medical Research Building. This structure is over 250,000 square feet and currently sits in the top five most energy intensive buildings on campus. Overall, ESS is hoping to add three buildings per year over the next three years, with the process of installing FDD at each new building taking several months to complete. ESS anticipates that as more buildings are added to the FDD software they will save over 7,500 metric tons of carbon dioxide emissions over the next three years, making a dent in the University’s overall emissions in addition to other projects over the coming years
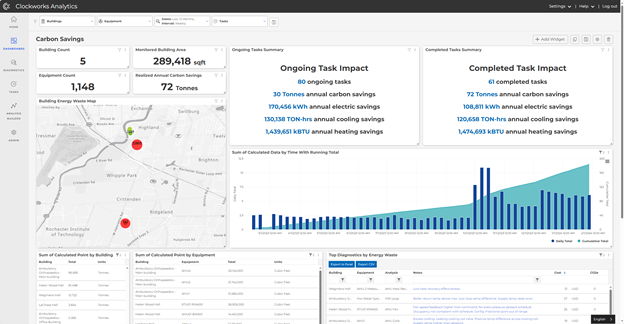
Dashboards show energy performance for buildings using FDD software.
Written by Sarah Woodams ’24(T5)
Photo by Sarah Woodams ’24(T5)