
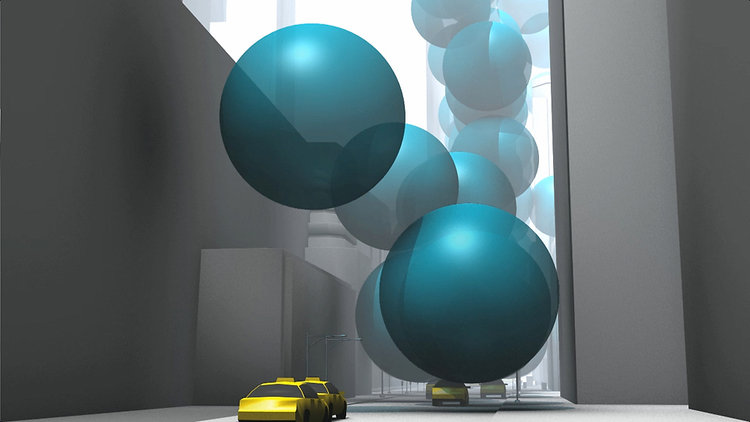
The video above is a visual representation of the amount of carbon dioxide generated in New York City every day. The data is from a study conducted by Major Michael Bloomberg’s Office of Long Term Planning and Sustainability.
The visuals rely on the assumption that one ton of CO2 would fill a sphere 33 feet across – the large, blue orbs in the video. For artistic effect, each of the spheres emerge at the same spot in downtown Manhattan.
After the first hour of emissions (1:35), we can see the gas bubbles gathered at half the height of the Empire State Building. After a day (1:48), the bubbles have almost covered the building and its surrounding area. After a year (1:60), the entire island is buried. New York City is making significant progress in reducing its carbon footprint. To find out more about New York’s sustainability efforts, read about Mayor Bloomberg’s Office of Long Term Planning and Sustainability.
By Alanna Scheinerman, Class of 2013
Related articles


